
Artemis II trajectory — Earth to lunar flyby and return. The timeline below follows my observations along this path. Image: NASA/Goddard Space Flight Center.
On April 1, 2026, NASA launched four astronauts toward the Moon aboard Artemis II. Using open data and open-source tools, I detected the rocket from space, tracked its exhaust, chased the spacecraft with robotic telescopes, and listened for it with seismic and infrasound sensors. From my home in Toronto.

Two days before launch. I downloaded ESA's Sentinel-2C imagery of Kennedy Space Center at 10 metres per pixel via the STAC API. You can see the pad structure, the flame trench, the crawlerway leading south to the Vehicle Assembly Building, and the Atlantic coastline. The SLS rocket is on the pad, waiting.

I pulled imagery from three different satellites to watch the weather over Florida. MODIS on Terra sees the Space Coast up close from 705 km. VIIRS on NOAA-20 captures the full peninsula from 824 km. GOES-19 watches from geostationary orbit at 35,786 km, updating every minute. Between them: partly cloudy skies, clearing toward evening. Go for launch.

6:35 PM. Twin boosters and four RS-25 engines fire. I processed GOES-19's raw infrared data — the satellite watches from 35,786 km above the equator — and found a sudden heat spike at the exact coordinates of Launch Complex 39B. Each pixel covers roughly 2 km — the rocket's exhaust is diluted across that entire area — yet one pixel lights up clearly above the local background. That bright dot is the rocket.

I built this animation from seven raw NetCDF files at 30-second intervals, from T−30 seconds through T+150 seconds. Two overlapping mesoscale sectors give this cadence. I subtracted the pre-launch image so only new heat remains. A dot of fire appears, brightens, drifts northeast, then vanishes.

I compared the same moment across three different wavelengths. In visible light — it's 6:36 PM, the sun is setting — the plume is lost in the clouds. In infrared at 3.9 μm, the exhaust blazes like a lighthouse against the cool ocean. In the fire detection channel — the same algorithm NOAA uses to spot wildfires from space, comparing shortwave IR against the longwave background — the rocket produces a strong, unambiguous signal. Same physics as a wildfire, except this one is moving at 7 km/s.

I searched for Raspberry Shake stations near the launch site — citizen-science seismographs built on Raspberry Pis, thousands deployed worldwide, all openly available through FDSN. I found stations at 23 km and 52 km from KSC, pulled their data, and ran it through ObsPy. Both showed strong acoustic-coupled seismic signals beginning 60–100 seconds after launch. The signal arrives at the speed of sound (340 m/s), not at seismic body-wave velocity (6 km/s) — confirming I was seeing atmospheric propagation, not an earthquake. The signal lasted over 2 minutes, matching the 126-second Solid Rocket Booster burn — each second of ascent sending a new wavefront from progressively higher altitude.

SLS produces over 200 dB of acoustic energy at the pad — I wanted to see how far that signal travelled. I queried the Raspberry Shake/Boom network and the International Monitoring System (IMS, run by the Comprehensive Nuclear-Test-Ban Treaty Organization) for stations within range of KSC. I found 6 Raspberry Boom infrasound sensors within 320 km — and when I plotted their signal-to-noise ratios, the arrival times lined up perfectly with distance, consistent with atmospheric propagation at ~300 m/s.

I built my own infrasound station on my apartment balcony in Toronto: a Raspberry Boom sensor (sensitive below 20 Hz) inside a handmade wind-noise enclosure — a bucket with holes patched with steel wool to reduce wind turbulence while allowing pressure waves through. My Raspberry Boom (R3635) experienced a hardware failure before launch day. My Raspberry Shake seismometer (RC893) recorded continuously but did not detect the launch — expected, as acoustic-to-seismic coupling at 1,670 km produces ground motion far below the sensor noise floor.


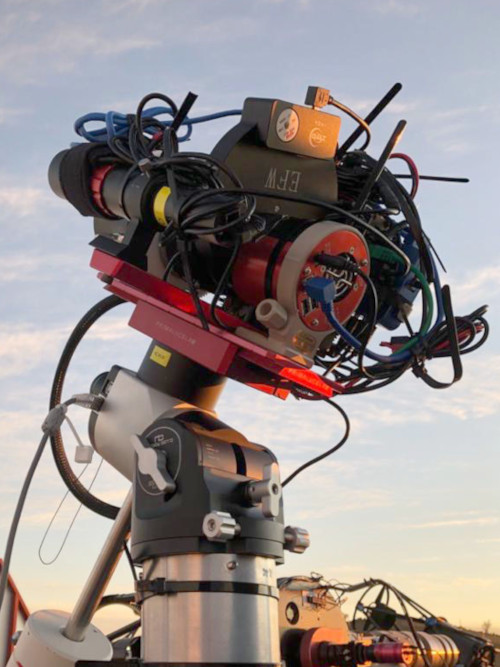
Within hours of liftoff, I had robotic telescopes in Chile pointed at where Orion should be. The first image came from T70 in Río Hurtado, Chile, about 4 hours after launch — 6 exposures, 1 second each. At that point Orion was racing across the sky at 127.9 arcsec/min — 22 pixels per minute on T70's sensor — with uncertain coordinates due to possible thruster firings and manoeuvres. My measured position matched JPL Horizons to within 11.9 arcsec (2 pixels). T70's narrow field could only hold it briefly, so I switched to T75's wider field for the main observation run.


That dot is this — NASA's Orion spacecraft, carrying four astronauts to the Moon. Image: NASA.
By hour 8, T75 in Chile had captured 68 frames of Orion and the ICPS separately. I ran photometry on both. Orion held steady around mag 11.5 in V-band — except for one frame where it flared to mag ~10, possibly a small thruster firing. After correcting for changing distance, the fading trend disappeared — confirming it was geometry, not the spacecraft dimming.


The Interim Cryogenic Propulsion Stage — 13.7 m long, 5 m diameter, powered by a single RL-10 engine. After pushing Orion toward the Moon, it separates and tumbles on its own. Image: NASA.
In my data the ICPS faded from mag ~10 to ~12.75 in 30 minutes — sunlight catching a spinning cylinder at different angles. I built a periodogram and phase-folded the data. The result: a rotation period of 0.376 hours (22.6 minutes), with a clean double-peaked curve consistent with a tumbling cylindrical body.


ICPS rotation period: 0.376 hours (22.6 minutes). Amplitude: ~2 magnitudes.
In the same 1° field of view as Orion, a streaking object appeared — not physically close, but passing through the same patch of sky as seen from Earth, 22,605 km away in its own unrelated orbit. I measured its position across 11 consecutive 1-second CCD exposures using Tycho 13.3, plate-solved against ATLAS2, and formatted a standards-compliant ADES astrometric report. I submitted it to Project Pluto's satellite identification service.
As crewed missions beyond low Earth orbit become more frequent, documenting and reporting debris encounters like this — even line-of-sight coincidences — contributes to the growing catalogue that keeps future flights safe.

NORAD 20356 (1989-090C) — a discarded Inertial Upper Stage (IUS) rocket body, orbiting since 1989 in a highly elliptical path (e = 0.64, i = 27.7°, period 410 min). It was 22,605 km from Earth at the time — nowhere near Orion, just crossing the same line of sight. Computed angular motion of 17.2252″/s at PA 101.2° matched my observed 17.2419″/s at PA 101.1°.
V-band magnitudes 10.1–10.6. All positions plate-solved against ATLAS2 with RMS fits 0.33–0.52 arcsec.
T80 in Spain caught Orion for the first time — 10 fast exposures at 0.1 seconds. At this point Orion and the ICPS were still within 10 metres of each other, appearing as a single unresolved blob. Then T75 in Chile ran the longest session yet: 124 frames over nearly an hour.

T75 Chile session (124 frames): Analysis in progress.
Clouds across all three observatory sites. No data. Orion keeps flying — I wait.
Orion is coasting toward the Moon at roughly 160,000 km from Earth. It's fainter now — I increased exposures from 1 second to 30 seconds to keep the signal. 60 images over nearly an hour from T75 in Chile.
Analysis in progress.

Orion is deep in cislunar space, closing on the Moon. 20 images from T30, Siding Spring, Australia, at 60-second exposures. Exposure time has doubled again — the spacecraft is now twice as far as two nights ago.
Analysis in progress.

The crew has just flown around the far side of the Moon and broken Apollo 13's distance record at 406,771 km. Orion emerged from behind the Moon and I caught it again — 25 images from the same T30 in Siding Spring, Australia.
Analysis in progress.

Apr 2: 127.9″/min — racing away from Earth, hard to track. Apr 5: 7.3″/min — 17× slower, coasting at 160,000 km. Apr 6: 11.0″/min — speeding up again as the Moon's gravity bends the trajectory into the flyby. The exposures tell the same story: 1s → 30s → 60s, chasing a spacecraft that was getting farther and fainter every night.
Orion is now heading home. Three trajectory correction burns fine-tune the approach. On April 10, the crew re-enters the atmosphere at 40,000 km/h — the fastest crewed re-entry ever attempted — and splashes down in the Pacific near San Diego. I'll be listening with every sensor I have.
Forthcoming: Re-entry infrasound · Splashdown seismoacoustics · arXiv preprint
In 2017, I won the Canadian Space Agency's Space Apps Challenge — a NASA-led global hackathon. As a prize, my brother and I were invited to CSA headquarters in Saint-Hubert, Quebec. I was seven years old. There, I met Jeremy Hansen — now the first Canadian to fly to the Moon as Mission Specialist on Artemis II — and Jenni Gibbons, his backup for this mission. Nine years later, I'm tracking Hansen's spacecraft from my apartment in Toronto.
Read the full story of our CSA visit


Raspberry Shake (EHZ) + Boom (HDF) citizen-science networks. IMS arrays via CTBTO. DWPF broadband.
25+ stations queriedSentinel-2C (ESA), GOES-19 ABI (NOAA), MODIS/Terra (NASA), VIIRS/NOAA-20.
Open archivesAstroPy, Photutils, ObsPy, Astrometry.net, Tycho 13.3, Astroquery, GDAL, Project Pluto.
All FOSSLomb-Scargle periodograms, differential photometry, ADES astrometric reports, STA/LTA triggers.
ReproduciblearXiv preprint forthcoming. Full data + code to be released. CC-BY-4.0.
Open access